Market Analysis1 July 2026
Immigration vs Building Approvals: What the Data Says About Australia's Housing Market
A state-by-state look at whether Australia is building enough homes to house the people arriving in it, and what the gap between supply and demand means for property.
Sources: ABS population release (December 2025); ABS building approvals monthly trend (May 2026); NHSAC published state shares of the National Housing Accord target (2025). All figures are as published. This article is educational and does not constitute personal financial advice.
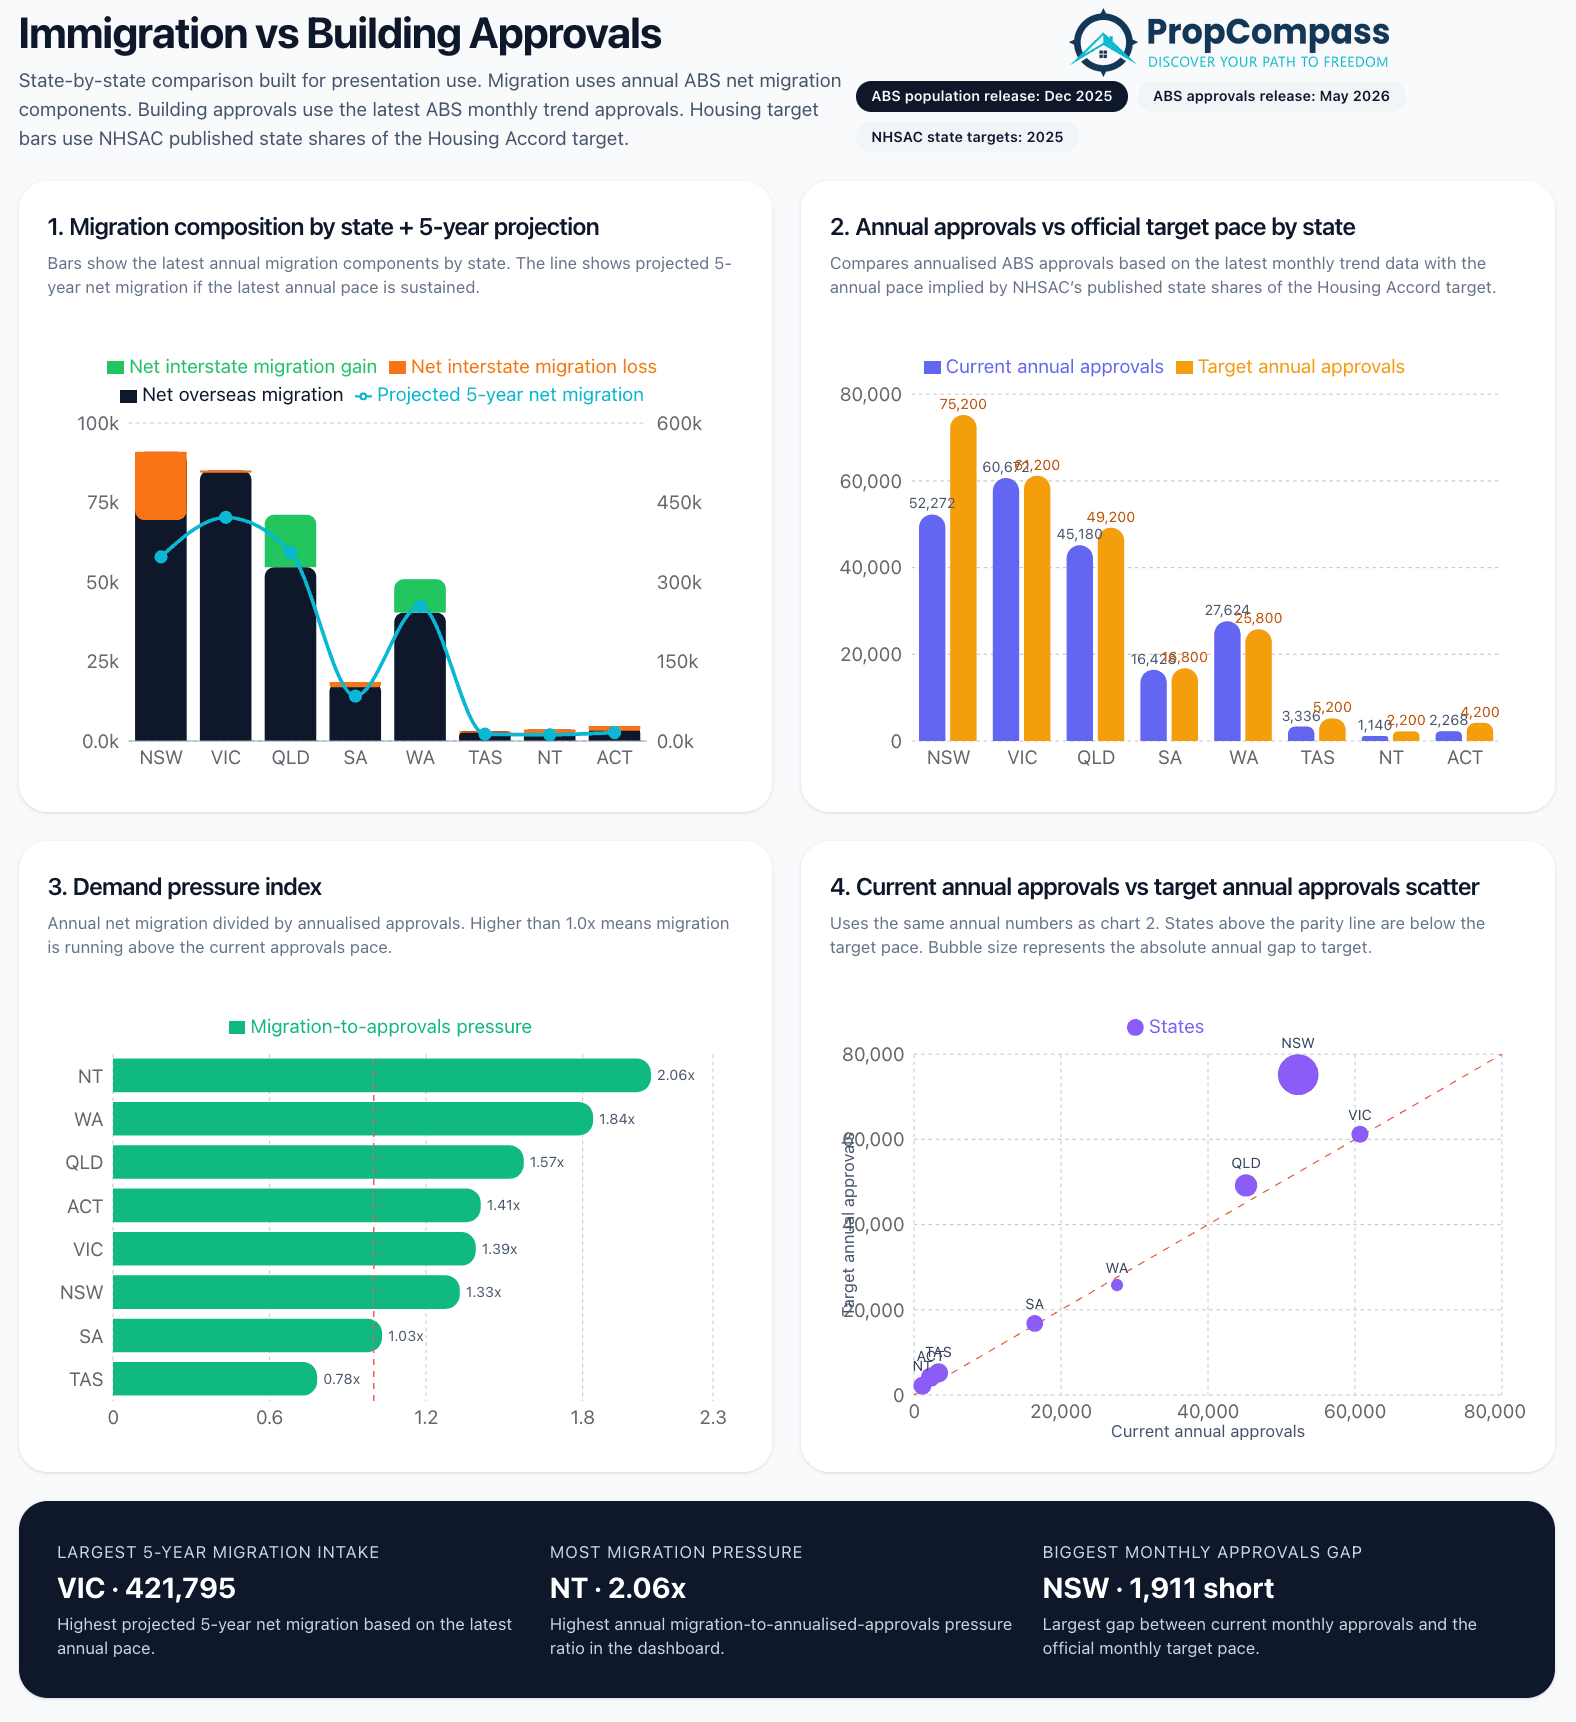
Largest 5-year migration intake
VIC
421,795
Highest projected 5-year net migration at the current annual pace
Most migration pressure
NT
2.06x
Migration running at more than double the rate of building approvals
Biggest monthly approvals gap
NSW
1,911 short
Largest gap between current monthly approvals and the official monthly target
The following four charts compare immigration and building approvals across every Australian state and territory, using the most recent available data. The analysis uses the National Housing Accord targets as the benchmark for what each state should be approving each month. The charts are taken directly from a state-by-state dashboard built for presentation use.
Taken together, they answer a straightforward question: is Australia building enough homes to house its growing population? The short answer, in seven of eight jurisdictions, is no.
Sources: ABS population release Dec 2025, ABS approvals release May 2026, NHSAC state targets 2025
1
Migration composition by state and 5-year projection
Bars show the latest annual migration components by state. The line shows projected 5-year net migration if the latest annual pace is sustained.
The first chart breaks population growth into its two components for each state: net overseas migration and net interstate migration. States with green bars above the horizontal axis are gaining residents from other Australian states. States with orange bars are losing residents to other states. The teal line shows where each state is projected to sit on cumulative net migration over the next five years if the current annual rate continues.
Victoria carries the largest projected 5-year net migration intake at 421,795. New South Wales has substantial overseas migration but is simultaneously losing residents to other states on a net basis, meaning that orange interstate loss bar partially offsets the overseas arrivals. The net result is that VIC is projected to absorb more people than NSW over the coming five years despite NSW being the most populous state.
Queensland and Western Australia are gaining from both directions at once. Both states show positive interstate migration on top of their overseas intake. This dual-source demand is significant because it is driven by different factors: overseas migration responds to visa policy, while interstate movement reflects affordability, employment, and lifestyle preferences. A state attracting both simultaneously is facing compound demand that is harder to predict and plan for.
South Australia is recording modest positive migration across both categories. Tasmania, the Northern Territory, and the ACT have smaller absolute flows, though their supply situations relative to those flows are covered in Charts 3 and 4.
What this chart shows
Victoria will need to absorb the largest number of additional residents of any state over the next five years at the current pace. Queensland and Western Australia face demand from two separate sources simultaneously, which is harder to offset through approvals alone.
2
Annual approvals vs official target pace by state
Compares annualised ABS approvals based on the latest monthly trend data with the annual pace implied by NHSAC's published state shares of the Housing Accord target.
The second chart places each state's current annual building approvals alongside the annual pace required to meet its Housing Accord target. The blue bars show annualised approvals derived from the latest ABS monthly trend data released in May 2026. The orange bars show the annual pace implied by each state's NHSAC Housing Accord target.
Western Australia is the only state or territory currently approving homes above its Housing Accord target pace, at 27,624 approvals per year against a target of 25,800. Every other jurisdiction is running short, ranging from a gap of 372 per year in South Australia to 22,928 per year in New South Wales.
New South Wales has the largest absolute shortfall. At 52,272 annual approvals against a target of 75,200, NSW is approving approximately 70 cents of housing for every dollar of supply its official target requires. That annual shortfall of 22,928 dwellings, or roughly 1,911 per month, compounds over time. Even if approvals were to lift immediately to the target rate, the cumulative backlog built up over years of underbuilding would take years to clear.
Victoria is the second-largest shortfall in absolute terms at 12,540 per year, despite having a higher current approval rate than any other state. The gap reflects how large Victoria's Housing Accord target is relative to its current output, not a failure of construction activity compared to other states.
Queensland at 4,020 per year, the ACT at 1,932 per year, and Tasmania at 1,860 per year each carry shortfalls that, while smaller in absolute numbers, are meaningful relative to the size of those markets.
What this chart shows
Seven of eight jurisdictions are building below their Housing Accord target pace. Western Australia is the only exception. New South Wales has the largest annual shortfall at 22,928 dwellings (approximately 1,911 per month), followed by Victoria at 12,540 per year.
3
Demand pressure index
Annual net migration divided by annualised building approvals. A reading above 1.0x means migration is running above the current approvals pace.
The third chart calculates a demand pressure index for each state by dividing annual net migration by annualised building approvals. A reading of 1.0x means migration and approvals are in balance at the current rate. Above 1.0x means migration is running faster than the rate at which homes are being approved. Below 1.0x means approvals are outpacing migration. The dashed red line marks the 1.0x threshold.
The Northern Territory records the highest pressure reading at 2.06x, meaning migration is running at more than double its current approvals rate. Tasmania is the only jurisdiction below 1.0x at 0.78x, indicating that building activity there is keeping pace with, and modestly exceeding, its migration intake.
Western Australia presents an apparent contradiction with Chart 2. WA is the only state approving above its Housing Accord target, yet its pressure index is 1.84x, the second highest in the country. This is because the Housing Accord target and the demand pressure index measure different things. The target is a policy benchmark set in 2025. The pressure index reflects the actual pace of migration arriving now. In WA's case, migration has accelerated to a rate that even above-target approvals cannot match.
Queensland at 1.57x and the ACT at 1.41x each have migration running materially faster than their approvals pipelines. Victoria at 1.39x is slightly below the ACT despite having far higher absolute volumes of both migration and approvals.
South Australia at 1.03x is marginally above the threshold, meaning demand and supply are close to balance but migration still has a slight edge over the approvals rate.
What this chart shows
Seven of eight jurisdictions have migration running faster than their current approvals pace. Tasmania is the only exception. Western Australia is approving homes above its Housing Accord target and still cannot match the rate of people arriving.
4
Current annual approvals vs target annual approvals scatter
Uses the same annual numbers as Chart 2. States above the parity line are below their target pace. Bubble size represents the absolute annual gap to target.
The fourth chart plots each state on two axes: current annual approvals on the horizontal axis and target annual approvals on the vertical axis. A diagonal parity line runs from bottom-left to top-right. Any state sitting above that line is approving fewer homes than its target requires. The size of each bubble represents the absolute annual shortfall against target.
New South Wales sits furthest above the parity line and has the largest bubble. Its current annual approvals of 52,272 are well below its target of 75,200, placing it in the upper-right section of the chart with a gap that no other state approaches in absolute terms.
Victoria sits above the parity line with a moderate bubble, reflecting its 12,540 annual shortfall. It sits furthest to the right on the horizontal axis of any state, confirming it has the highest current approvals rate in the country while still falling short of its target.
Queensland appears above the parity line with a smaller bubble, consistent with its 4,020 annual shortfall. Western Australia sits on or below the parity line, confirming Chart 2's finding that it is meeting its target.
South Australia, Tasmania, the NT, and the ACT cluster in the lower-left section of the chart. Their absolute annual volumes are smaller, so their bubbles are smaller, but their positions relative to the parity line still indicate shortfalls in most cases.
What this chart shows
The scatter confirms Charts 2 and 3 in visual form. NSW has the largest absolute annual gap to target at 22,928 dwellings. Victoria is building at the highest annual rate of any state and is still 12,540 short. WA is the only state on or below the parity line.
Where is the Australian housing market headed?
The four charts above describe the same structural condition from four different angles: Australia is not approving homes at the pace required to house its current rate of population growth, and that gap is concentrated in the states with the highest demand.
The National Housing Accord set state-level targets to guide supply planning. As of the May 2026 ABS approvals release, seven of eight jurisdictions are running below those targets. The one state meeting its target, Western Australia, is still recording a migration-to-approvals pressure index of 1.84x because migration has grown faster than the targets anticipated.
The supply shortfall has direct consequences for the rental market. When more people are seeking housing than the supply pipeline is delivering, vacancy falls and rents rise. With migration outpacing approvals in seven jurisdictions simultaneously, rental pressure is a national condition rather than a localised one.
New South Wales is the most acute case. The state with the largest economy and the primary destination for overseas arrivals is approving roughly 22,928 fewer dwellings per year than its own target requires, approximately 1,911 per month. That gap does not correct quickly. Building approvals today translate into completed dwellings 18 to 24 months later at the earliest, and approval rates cannot be doubled overnight. The cumulative shortfall that has built up over several years will persist even if the approvals trend improves from here.
Victoria will absorb more people than any other state over the next five years at the current pace. It is also building at a higher annual rate than any other state. The problem is that the annual target set to accommodate that intake is 73,200 approvals, and the current annualised rate is 60,660. That annual gap of 12,540 dwellings means even strong construction output is falling short of what is needed.
Queensland and Western Australia face compounding demand from interstate and overseas migration simultaneously. Both states have pressure indices above 1.5x. Queensland is approving 4,020 fewer homes per year than its target. These are not marginal shortfalls. At the same time, both states have price points that remain more accessible than Sydney, which continues to attract people from the eastern capitals.
South Australia at 1.03x and Tasmania at 0.78x are the least pressured markets on the demand index. Tasmania is the only jurisdiction where the current approvals rate is keeping pace with migration, which is a meaningful distinction from the rest of the country.
The outlook implied by this data is straightforward. Unless building approvals lift materially and consistently across the major states, or unless migration slows significantly, the imbalance between housing supply and demand is likely to persist. That imbalance supports rental income for landlords in undersupplied markets and provides a structural floor under property values in areas where population is growing faster than the housing stock. The states where both conditions are strongest, NSW, VIC, QLD, and WA, are the ones where this structural support is most evident in the current data.
Key findings at a glance
- Seven of eight states and territories are building below their Housing Accord target pace.
- NSW has the largest annual shortfall at 22,928 dwellings below target, or approximately 1,911 per month.
- VIC has the highest projected 5-year migration intake at 421,795 and is still 12,540 short of its annual target.
- WA is the only jurisdiction above its annual target, yet its migration pressure index of 1.84x is the second highest in the country.
- NT records the highest pressure index at 2.06x, with migration running at more than double its approvals rate.
- TAS is the only jurisdiction where approvals are currently outpacing migration, at 0.78x.
- QLD and WA face dual demand from both overseas arrivals and interstate migration.
Thinking about which market to invest in based on the supply data?